Tax-inclusive reference prices in CNY. Negotiable; the quotation reflects the selected configuration, quantity and delivery requirements. All products carry a 3-year warranty.
For a complete system, include the power supply, sensors, communication access and platform deployment in your enquiry.
At a glance
MeasurementsThree-phase voltage, current, power and energy
Harmonics2nd–63rd voltage/current harmonics and THD
IO6 inputs and 6 relay outputs
Temperature4 channels; 0.1°C display resolution
Product overview
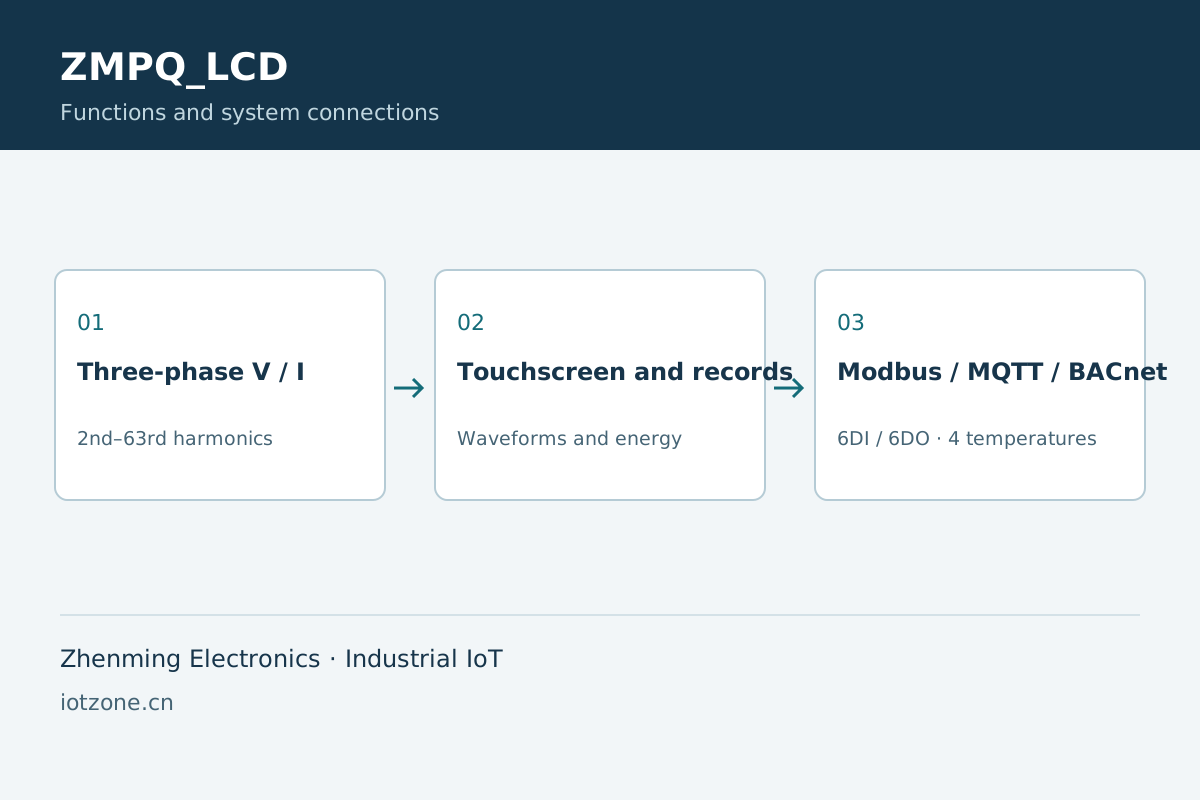
ZMPQ_LCD consolidates electrical measurements, waveforms, energy, temperature and events for distribution panels, buildings and factories. The local touchscreen and communication interfaces support operating review and system integration.
Functions and integration
Electrical and harmonic analysis
View phase and line voltages, current, power, power factor, frequency, phase angles and extrema, plus 2nd–63rd voltage/current harmonics and THD.
Waveform records
Live waveforms, freeze, snapshots, manual 10-second recording and alarm-triggered recording are supported. Six-channel recordings use a nominal 12.8kHz sample rate.
Energy and IO
Forward/reverse active and reactive energy, apparent energy, time-of-use and daily totals combine with six inputs, six relay outputs and 32 scheduling rules.
System access
Two RS485 ports provide Modbus RTU; Ethernet provides Modbus TCP, MQTT and BACnet/IP. CAN, logs and TF storage support integration and diagnostics.
Applications and operating workflow
Distribution monitoring
Review measurements and harmonics alongside equipment operating conditions.
Event investigation
Correlate alarms, snapshots and recordings with equipment switching and temperature measurements.
Building and factory systems
Map field data into supervisory systems through suitable industrial protocols.
Technical data and interfaces
Measurements
Three-phase voltage, current, power and energy
Harmonics
2nd–63rd voltage/current harmonics and THD
IO
6 inputs and 6 relay outputs
Temperature
4 channels; 0.1°C display resolution
Display
1024×600 bilingual touchscreen
Recording
6 channels, nominal 12.8kHz; manual 10 seconds
Interfaces
2 RS485 ports, CAN and Ethernet
Network protocols
Modbus TCP, MQTT and BACnet/IP
Schedules
32 rules
RS485 baud rate
2400–115200 bit/s; two independently configured ports
Classic CAN rates
125, 250, 500 kbit/s and 1 Mbit/s
CAN filtering
8 filter rules
Browser waveform windows
1, 2, 5 and 10 seconds
Selection and system combinations
Use the terminal for electrical measurements, power-quality analysis and operating records. Compare energy-monitoring terminals and branch acquisition modules for consumption-only or multi-branch reporting.
Select metering by three-phase wiring and direct or current-transformer input. Branch accounting and power-quality diagnosis are different data objectives with multi-circuit acquisition and power terminals.
Use the module for separate single-phase branch measurements rather than only a distribution total. Plan branches, current transformers and reporting dimensions; compare three-phase systems for whole three-phase loads.
Start routine review with three-phase voltage, current, power and power factor, then use extrema to locate changes during the operating period. Harmonics and waveform records provide additional context around an event. Consistent circuit naming and time references help distribution-panel, factory and building teams correlate equipment switching with electrical changes.
02
Use harmonics and six-channel records together
Harmonic views show voltage and current spectral content and THD; waveform records preserve six channels for a selected period. Freeze, snapshots, manual ten-second capture and alarm-triggered capture support event review. Compare the record with the load mix, starting sequence and event time to distinguish persistent operating changes from short events.
03
Relate energy totals to field operating states
Forward and reverse active and reactive energy, apparent energy, time-of-use totals and daily statistics support operating-period analysis. Six inputs add field states, while six relay outputs and schedules can participate in project control. Four temperature channels add site context. Organize terminals and branch meters by distribution level to relate incoming supply trends to branch demand.
04
Integrate with building and industrial systems
Ethernet supports Modbus TCP, MQTT and BACnet/IP, while two RS485 ports serve Modbus RTU links and CAN supports the corresponding project interface. Define measurement, status, control and event mappings with consistent names and units before organizing them by site and equipment. The touchscreen remains a local viewing point; the supervisory system provides multi-terminal aggregation and operation.
05
Connect equipment using the required protocols
The two RS485 interfaces have independent addressing, baud rates and framing. Ethernet protocols connect measurements, events and control points to supervisory systems, while classic CAN uses the selected bus rate and message filters. Define units and read/write roles separately for measurements, states, events and commands so that routine monitoring and output control have clear responsibilities.
06
Align timestamps and storage for event investigation
Manual, NTP and timestamp-command synchronization align the terminal with the project time reference. Logs, alarms, snapshots and waveform records can then be correlated by event time. Browser live-waveform windows span 1, 2, 5 or 10 seconds; recorded segments carry their own sampling and duration information. TF-card status and available capacity indicate the storage available for historical records.
07
Choose between live viewing, snapshots and waveform records
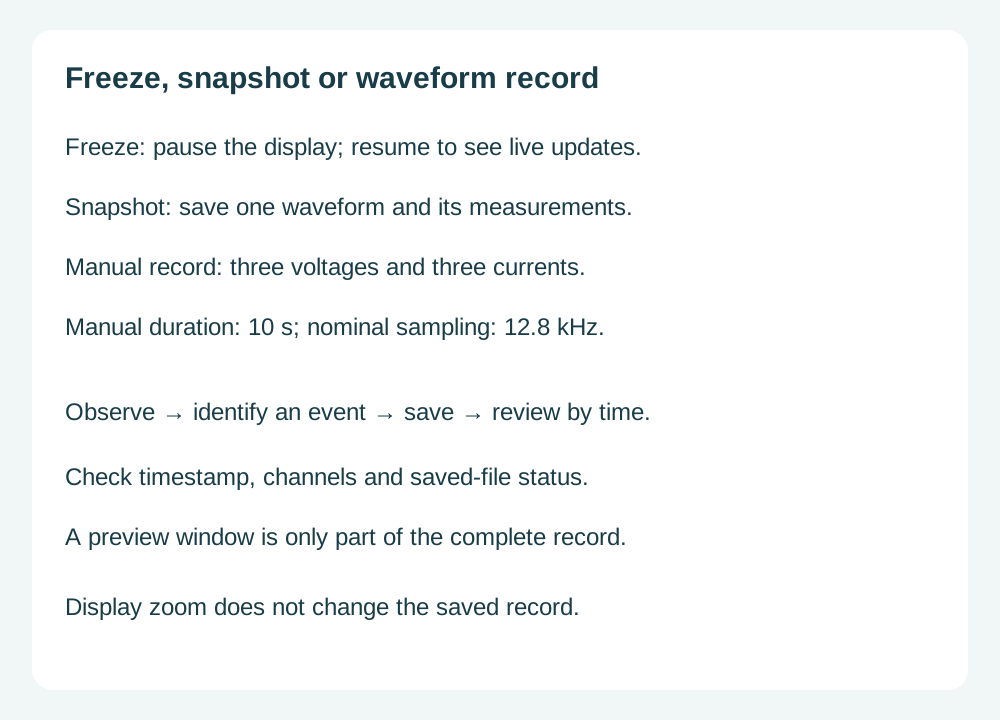
Freeze pauses the display for inspection; resume restores live updates. A snapshot saves one waveform with its measurements. Manual recording captures three-phase voltage and current across six channels for 10 seconds at a nominal 12.8 kHz. Locate saved records by timestamp and type, check file status, and then preview or export them. Display zoom does not alter stored data.
PQ display freeze, snapshot and six-channel recording reference
08
Compare harmonics using phase, fundamental and time
Review voltage and current separately for phases A, B and C. The harmonic spectrum is referenced to the fundamental, with harmonic order on the horizontal axis. Current readings show present conditions; historical maxima identify previous peaks. The largest individual harmonic and total harmonic distortion are different measures. Compare percentages, axis scales, load conditions and fundamental amplitude alongside event time.
Selection questions
How can the terminal be combined with branch meters?
Use the terminal on an incoming supply or critical circuit for electrical measurements, harmonics and waveform records. Branch meters provide floor, area or equipment demand, linked by the distribution hierarchy in the platform.
Why review current measurements and waveforms for one event?
Current measurements indicate demand, while a waveform record adds time-resolved changes. Three-phase data, harmonics and equipment switching times provide more complete context for an event.
Does freezing a waveform save a file?
Freeze only pauses the display. Use a snapshot or waveform recording to save data, then locate and preview the record by timestamp.
Does a historical harmonic maximum describe the present?
A historical maximum is a previous peak during the recorded period. Review current readings, phase, fundamental amplitude and load state to assess present conditions.
Frequently asked questions
Is 0.1°C the measurement accuracy?
It is display resolution. Probe characteristics, installation and measurement conditions determine accuracy.
Does it replace billing meters or protection equipment?
It supports operating review and diagnostics. Billing and protection require equipment and design suited to those functions.
Is a browser required for local viewing?
No. The local touchscreen provides its own data and operation interface.